Earlier, I reviewed the open source (OSS) NetFlow collector, as summarized in this article.
When I investigated again, I found ElastiFlow , a NetFlow collector and visualizer based on Elasticsearch + Logstash + Kibana (ELK stack).
The software is not completely open source (OSS), but is free under the author's Robert Cowart Public License.
- Required skills
- NetFlow exporter
- Install ElastiFlow
- Check NetFlow traffic
- Conclusion - Visualize NetFlow with ElastiFlow (Elasticsearch + Logstash + Kibana)
Required skills
Please note that this article requires the following knowledge in addition to basic knowledge of network devices (Router, Switch). (To utilize OSS on Linux, not on appliance)
For details, please refer to other sites. Recently, even network engineers are not only concerned with conventional CLI operation of Cisco, Juniper, etc., F5 BIG-IP, GUI operation of various appliances, but also IaaS, Linux, programming skills ...
- Basic operations of VM
- Basic Linux operations
- Basic Docker operations
- Basic knowledge of Elasticsearch, Logstash, Kibana
NetFlow exporter
Use NetFlow v5 with VyOS as the NetFlow exporter. When sent with NetFlow v9 it was not processed by Logstash...
Regarding NetFlow setting of VyOS, I referred to this article.
Install ElastiFlow
ElastiFlow can be built by installing a plugin template for the ELK stack. There is an official description of system requirements and installation.
Elasticsearch, Logstash, and Kibana can each be used with an open source license (not the X-Pack Elastic license). The procedure for building the ELK stack is omitted because many articles have been published.
In this case, ElastiFlow is built with Docker so that it can be easily used for testing.
Environment
The host that runs the ElastiFlow Docker container is as follows.
Docker uses the latest version of the community edition. * In old v1.13.x, an error occurs at Build. (Correspondence is possible by modifying Dockerfile) Omitting because there are many articles about Docker environment construction.
$ docker version
Client:
 Version:           18.09.3
 API version:       1.39
 Go version:        go1.10.8
 Git commit:        774a1f4
 Built:             Thu Feb 28 06:33:21 2019
 OS/Arch:           linux/amd64
 Experimental:      false

Server: Docker Engine - Community
 Engine:
  Version:          18.09.3
  API version:      1.39 (minimum version 1.12)
  Go version:       go1.10.8
  Git commit:       774a1f4
  Built:            Thu Feb 28 06:02:24 2019
  OS/Arch:          linux/amd64
  Experimental:     false

$ docker-compose version
docker-compose version 1.14.0, build c7bdf9e
docker-py version: 2.4.2
CPython version: 2.7.5
OpenSSL version: OpenSSL 1.0.1e-fips 11 Feb 2013
Launch ElastiFlow container
Clone, build, and launch the ElastiFlow repository.
$ git clone https://github.com/robcowart/elastiflow
$ cd ./elastiflow
$ ./docker_build.sh
Sending build context to Docker daemon  821.8MB
Step 1/11 : FROM docker.elastic.co/logstash/logstash-oss:6.1.3
 ---> bfbbe5b25fe6
Step 2/11 : ARG BUILD_DATE
 ---> Using cache
 ---> 31982c13d210
Step 3/11 : LABEL org.opencontainers.image.created="$BUILD_DATE"       org.opencontainers.image.authors="rob@koiossian.com"       org.opencontainers.image.url="https://github.com/robcowart/elastiflow-docker/elastiflow-logstash"       org.opencontainers.image.documentation="https://github.com/robcowart/elastiflow-docker/elastiflow-logstash/README.md"       org.opencontainers.image.source="https://github.com/robcowart/elastiflow"       org.opencontainers.image.version="v3.4.1_6.1.3"       org.opencontainers.image.vendor="Robert Cowart"       org.opencontainers.image.title="ElastiFlow™ - Logstash"       org.opencontainers.image.description=""
 ---> Running in b035b0d67d0c
Removing intermediate container b035b0d67d0c
 ---> 8dbda1604495
Step 4/11 : ENV ELASTIFLOW_ES_HOST="http://127.0.0.1:9200"
 ---> Running in 51935ee56198
Removing intermediate container 51935ee56198
 ---> 11da570d161a
Step 5/11 : RUN $HOME/bin/logstash-plugin install logstash-codec-sflow     && $HOME/bin/logstash-plugin update logstash-codec-netflow     && $HOME/bin/logstash-plugin update logstash-input-udp     && $HOME/bin/logstash-plugin update logstash-input-tcp     && $HOME/bin/logstash-plugin update logstash-filter-dns     && $HOME/bin/logstash-plugin update logstash-filter-geoip     && $HOME/bin/logstash-plugin update logstash-filter-translate
 ---> Running in 1c080aa843d5
Validating logstash-codec-sflow
Installing logstash-codec-sflow
Installation successful
Updating logstash-codec-netflow
Updated logstash-codec-netflow 3.10.0 to 4.2.1
Updating logstash-input-udp
Updated logstash-input-udp 3.2.1 to 3.3.4
Updating logstash-input-tcp
Updated logstash-codec-json_lines 3.0.5 to 3.0.6
Updated logstash-codec-multiline 3.0.9 to 3.0.10
Updated logstash-input-tcp 5.0.3 to 6.0.2
Updating logstash-filter-dns
Updated logstash-filter-dns 3.0.7 to 3.0.12
Updating logstash-filter-geoip
Updated logstash-filter-geoip 5.0.3 to 6.0.0
Updating logstash-filter-translate
Updated logstash-filter-translate 3.0.4 to 3.2.3
Removing intermediate container 1c080aa843d5
 ---> a021db633283
Step 6/11 : WORKDIR /usr/share/logstash/config
 ---> Running in 38e6b342d99e
Removing intermediate container 38e6b342d99e
 ---> f17a3a0602b9
Step 7/11 : COPY --chown=logstash:logstash ./docker_assets/logstash.yml ./
 ---> fe94fcf606a9
Step 8/11 : COPY --chown=logstash:logstash ./docker_assets/pipelines.yml ./
 ---> 1b607617f663
Step 9/11 : WORKDIR /etc/logstash/elastiflow
 ---> Running in 46dae18bc5f7
Removing intermediate container 46dae18bc5f7
 ---> 148f2f7f7ba1
Step 10/11 : COPY --chown=logstash:root ./logstash/elastiflow/ ./
 ---> 47f4642be2f5
Step 11/11 : ENTRYPOINT ["/usr/local/bin/docker-entrypoint"]
 ---> Running in 5f221fd60c53
Removing intermediate container 5f221fd60c53
 ---> f3d7a9193483
Successfully built f3d7a9193483
Successfully tagged robcowart/elastiflow-logstash-oss:3.4.1_6.1.3
Modify the parameters of docker-compose.yml as necessary. In my environment, I switched to memory reduction and use data volume containers.
$ git diff
diff --git a/docker-compose.yml b/docker-compose.yml
index af66265..434ca39 100644
--- a/docker-compose.yml
+++ b/docker-compose.yml
@@ -28,12 +28,12 @@ services:
         hard: -1
     network_mode: host
     volumes:
-      - /var/lib/elastiflow_es:/usr/share/elasticsearch/data
+      - elastiflow-elasticsearch-oss-data:/usr/share/elasticsearch/data
     environment:
       # JVM Heap size
       #   - this should be at least 2GB for simple testing, receiving only a few flo
       #   - for production environments upto 31GB is recommended.
-      ES_JAVA_OPTS: '-Xms2g -Xmx2g'
+      ES_JAVA_OPTS: '-Xms1g -Xmx1g'

       cluster.name: elastiflow

@@ -70,7 +70,7 @@ services:
     network_mode: host
     environment:
       # JVM Heap size - this MUST be at least 3GB (4GB preferred)
-      LS_JAVA_OPTS: '-Xms3g -Xmx3g'
+      LS_JAVA_OPTS: '-Xms2g -Xmx2g'

       # ElastiFlow global configuration
       ELASTIFLOW_DEFAULT_APPID_SRCTYPE: "__UNKNOWN"
@@ -82,3 +82,8 @@ services:
       ELASTIFLOW_NETFLOW_IPV4_PORT: 2055
       ELASTIFLOW_SFLOW_IPV4_PORT: 6343
       ELASTIFLOW_IPFIX_TCP_IPV4_PORT: 4739
+
+volumes:
+  elastiflow-elasticsearch-oss-data:
+    driver: local
Start a set. Logstash uses the image built earlier. If firewall is set, allow the port to be used.
$ sudo docker-compose up
Starting elastiflow-elasticsearch-oss ...
Starting elastiflow-elasticsearch-oss ... done
Starting elastiflow-kibana-oss ...
Recreating elastiflow-logstash-oss ...
Recreating elastiflow-logstash-oss
Recreating elastiflow-logstash-oss ... done
Attaching to elastiflow-elasticsearch-oss, elastiflow-kibana-oss, elastiflow-logstash-oss
elastiflow-elasticsearch-oss    | OpenJDK 64-Bit Server VM warning: Option UseConcMarkSweepGC was deprecated in version 9.0 and will likely be removed in a future release.
elastiflow-elasticsearch-oss    | OpenJDK 64-Bit Server VM warning: UseAVX=2 is not supported on this CPU, setting it to UseAVX=1
elastiflow-elasticsearch-oss    | [2019-03-16T05:08:33,729][INFO ][o.e.e.NodeEnvironment    ] [B0ID7Xo] using [1] data paths, mounts [[/usr/share/elasticsearch/data (/dev/mapper/VG1-var)]], net usable_space [59.5gb], net total_space [83.9gb], types [xfs]
...
When the following log of Logstash is output, an index for NetFlow is created in Elasticsearch.
elastiflow-logstash-oss | [2019-03-16T05:30:32,652][INFO ][logstash.outputs.elasticsearch] Attempting to install template {:manage_template=>{"order"=>0, "version"=>30401, "index_patterns"=>"elastiflow-3.4.1-*", "settings"=>{"index"=>{"number_of_shards"=>3, "number_of_replicas"=>1, "refresh_interval"=>"10s", "codec"=>"best_compression"}}, "mappings"=>{"_default_"=>{"numeric_detection"=>true, ...
It is docker-compose up for log confirmation, but it isdocker-compose up -d for continuous startup. Also, set restart: always indocker-compose.yml and set it to start automatically after restarting the OS.
Import data set on Kibana
Access Kibana and import the data of Template, Index pattern, Visualize, Dashboard.
Access https://<Docker host>:5601 from Web browser, import elastiflow/kibana/elastiflow.kibana.6.6.x.json(latest version) by Management > Saved Objects > Import .


Check NetFlow traffic
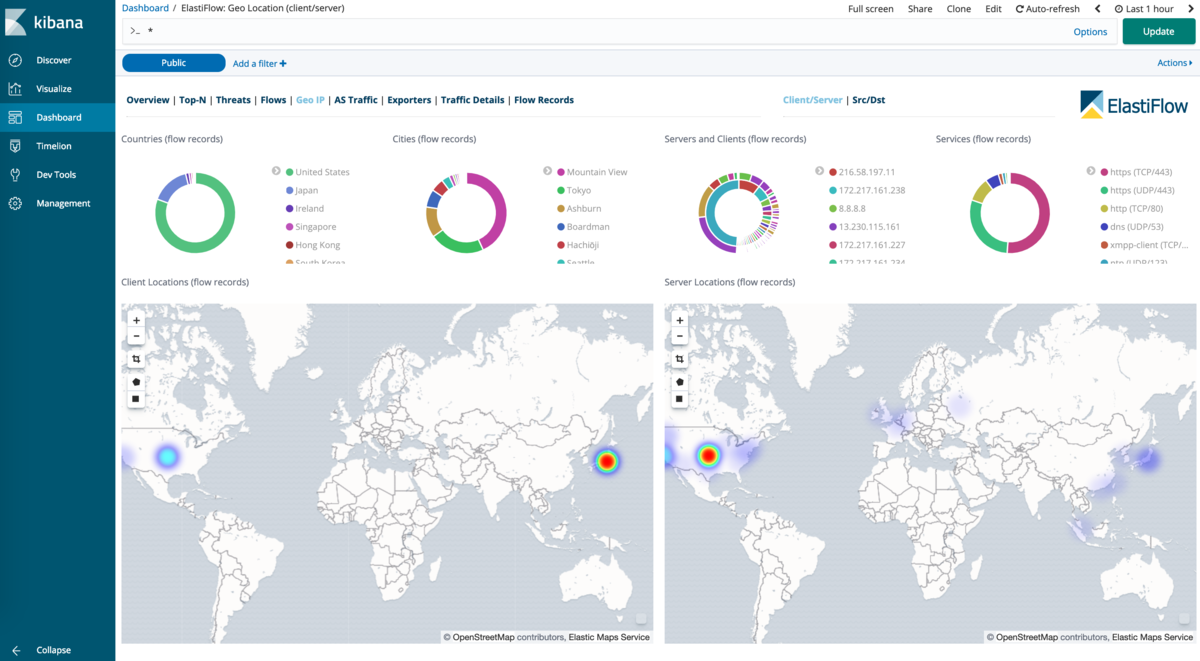
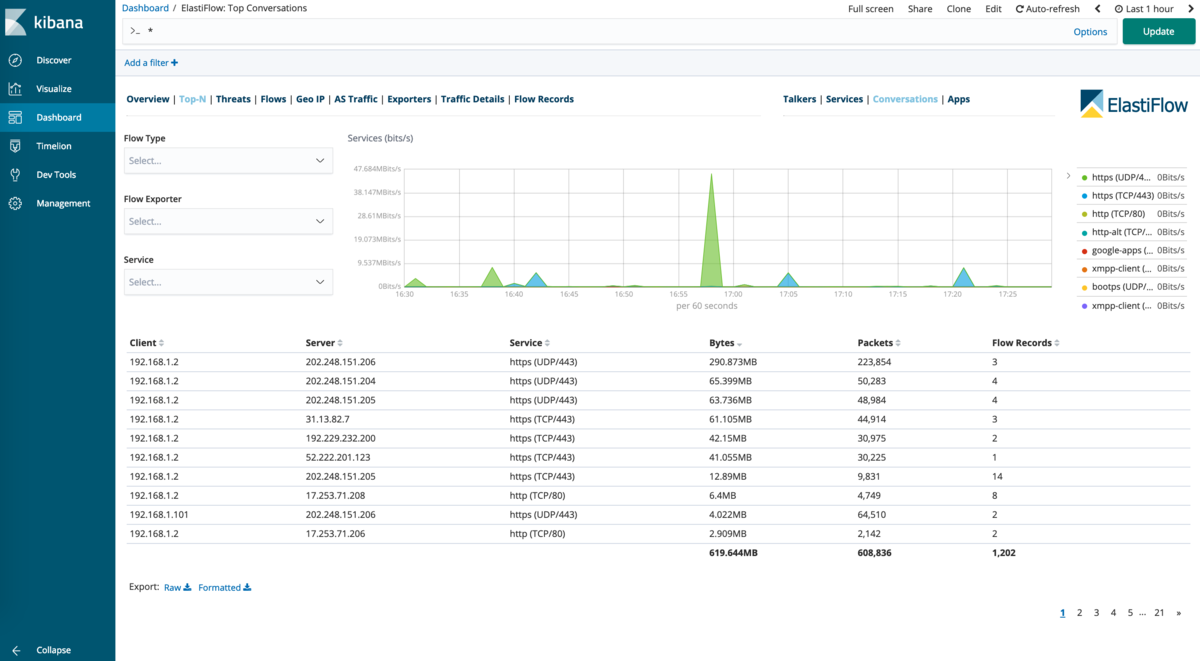
If NetFlow record generation / transmission / reception is working properly, it will be available on Kibana's dashboard.
Various dashboards are provided, which makes it easy to visualize and analyze network traffic based on NetFlow records. There are many parts that can be helpful when creating your own Visualize and Dashboard. Details of Dashboard are as described in Official.


Conclusion - Visualize NetFlow with ElastiFlow (Elasticsearch + Logstash + Kibana)
ElastiFlow was used as a NetFlow collector and visualizer to visualize the network. There are some examples of using open source (OSS) Elasticsearch + Logstash + Kibana in NetFlow visualization, but ElastiFlow has a rich dashboard, and it is possible to start analysis equivalent to commercial products immediately.