
Kibana is available as a log visualization tool for Elasticsearch, but sometimes I want to create a dashboard with Grafana by combining data such as ZABBIX. As a starting point, describe how to link Elasticsearch as Grafana's data source.
- Distinguish between Kibana and Grafana properly
- Installation Grafana and Elasticsearch
- Grafana Data Sources
- Dashboard creation
- Conclusion - Visualize Elasticsearch's data with Grafana
Distinguish between Kibana and Grafana properly
Introduction My choice between Kibana and Grafana.
Kibana: Search / Extraction (Detail)
As I wrote in this article, you can export the search results on the Discover tab to CSV by using Kibana's extended version.
Grafana: Dashboard (Overview)
It is mainly used as a dashboard to monitor the current operating status at a glance. In addition, since various plug-ins such as Influx DB, integrated monitoring such as ZABBIX and Prometheus are prepared as the data source, it is possible to aggregate a lot of information on one screen.
Installation Grafana and Elasticsearch
I omit it. Since there are Yum repositories and official dockers, installation is easy. There is no problem in log collection either Fluentd (td-agent) or Logstash.
Grafana Data Sources
Add Elasticsearch as Grafana's Data Sources. Select Type: Elasticsearch as below and enter the URL. Name is optional. When Access is set to Proxy, Grafana himself goes to acquire data.

Enter Index. As usual Pattern: Daily as [<logstash-prefix>-]YYYY.MM.DD.
Note that Pattern: No pattern also works as <logstash-prefix>-*, but the official documentation on how to set it in YYYY.MM.DD is described.
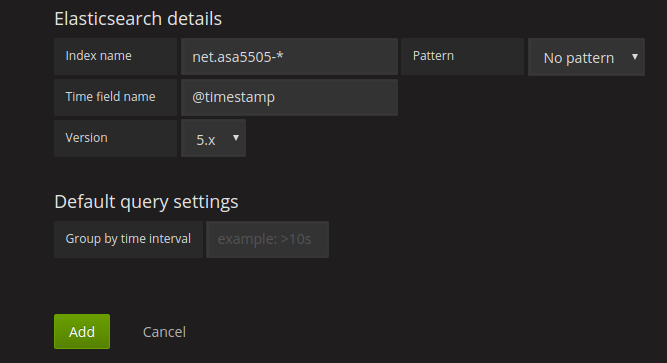
When registering with Add Datasource added is displayed.

Attention: Registration is completed even if setting is incorrect. If the log is not loaded correctly on the dashboard, reconfirm the setting. Also, ES v5.x is not supported in Grafana v3.x.
Dashboard creation
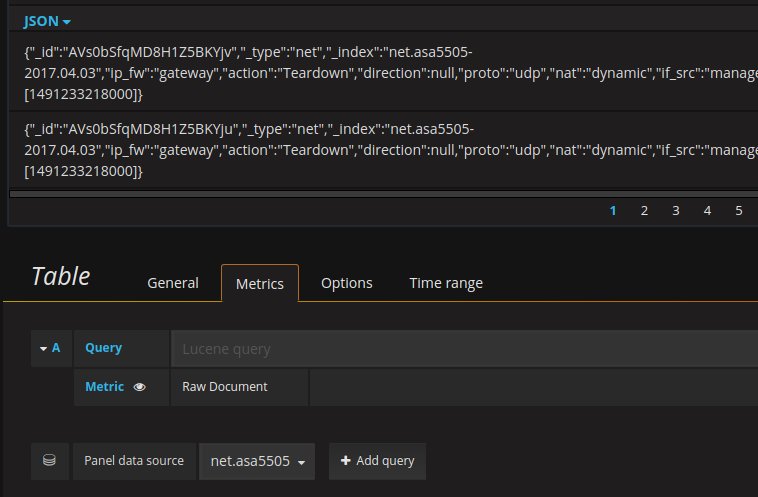
Create a Graph. If you specify the index of Elasticsearch linked by Panel data source and Metric: Count, Group by: Date Histgram, the graph of log number is displayed.

You can also display the raw log as Metric: Raw Document from the Table.
JSON data can be displayed in table format by column designation.
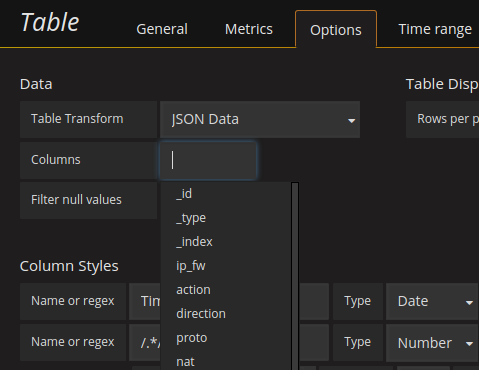
You can arrange the necessary information by specifying more than one.
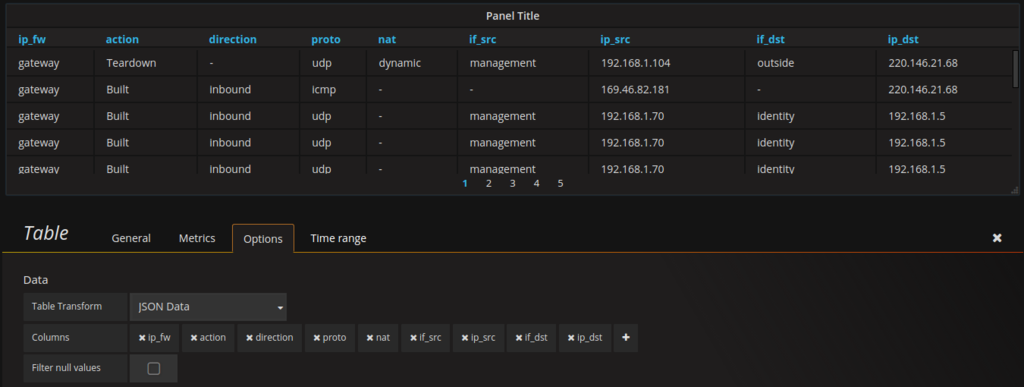
Since you can specify queries when creating panels, customize them. Although it has not been able to differentiate from Kibana, it is possible to create a dashboard as appropriate by only FW access log. I want to be even cooler with GEO IP etc.

Conclusion - Visualize Elasticsearch's data with Grafana
I was able to capture Elasticsearch data into Grafana. Since various queries can be used continuously, flexibility is high, and it is possible to create a dashboard according to the application.